If the dataset has a location column, you can use an inline filter to find rows within a geographic circle. You submit a longitude and latitude of a center point along with a radius, in meters. You'll get back rows where the location position is within that circle.
Let's look for nearby potholes. Use the Chicago Data Portal's 311 Service Requests - Potholes Reported (2011) dataset. It has a row for every pothole complaint that includes a location column.
The example code was based on the SODA query shown at the bottom of this page.
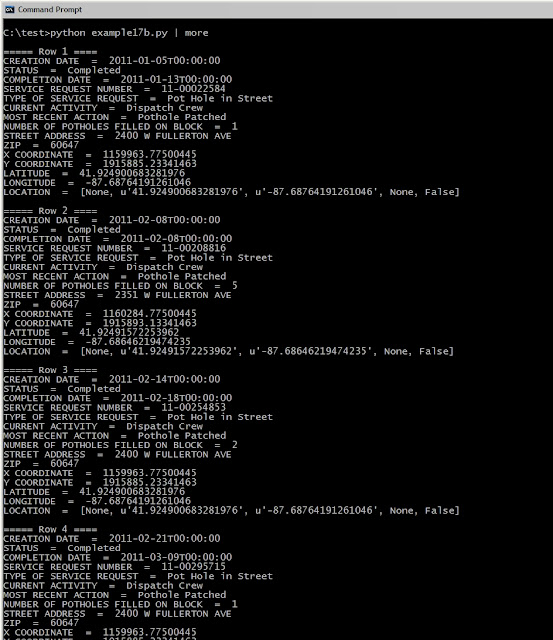
The first example will find potholes within 100m of 2400 W. Fullerton Ave. That address currently appears in the fourth row in the table. We can see the latitude and longitude in the table and hard-code them in this code
Create the inline filter
When I created the code, I cut and pasted the filter from the SODA page. I then made eight changes to the query:
- Changed the value for "originalViewId" to 7as2-ds3y. This is the ID for the pothole dataset.
- Changed the value for "name" to "Nearby potholes"
- Removed the "metadata" key/value. It seems unneeded. There's no documentation so this is a guess that seems to work out.
- Removed the "OR" operator. Ditto.
- Changed the value for "column" to 2793590. This is the ID for the location column in the view.
- Changed the value for the first "literal" to 41.9249. This is latitude.
- Changed the value for the second "literal" to -87.6876. This is longitude. I took the lat and long from the dataset for 2400 W. Fullerton Ave. It's currently the fourth row in the table. We should get at least this pothole back in our results.
- Changed the value for the literal "1000" to "100". This is the circle radius in meters. The bigger circle returns many potholes - more than we need for this example.
The rest of the code was copied from Example #16b. It will search through the dataset, find the rows with potholes within 100m of latitude 41.9249/longitude -87.6876, and print the column names along with the values for that row.
import json
import httplib
import pprint
from sys import exit
hostName = "data.cityofchicago.org"
service = "/views/INLINE/rows"
formatType = "json"
parameters = "method=index"
headers = { "Content-type:" : "application/json" }
query = {
"originalViewId": "7as2-ds3y",
"name": "Nearby potholes",
"query": {
"filterCondition": {
"type": "operator",
"value": "within_circle",
"children":
[
{
"type": "column",
"columnId": 2793590
},
{
"type": "literal",
"value": 41.9249
},
{
"type": "literal",
"value": -87.6876
},
{
"type": "literal",
"value": 100
}
]
}
}
}
jsonQuery = json.dumps(query)
request = service + '.' + formatType + '?' + parameters
conn = httplib.HTTPConnection(hostName)
conn.request("POST", request, jsonQuery, headers)
response = conn.getresponse()
if response.reason != 'OK':
print "There was an error detected."
print "Response status = %s.\n" % response.status
print "Response reason = %s.\n" % response.reason
raise SystemExit(1)
rawResponse = response.read()
jsonResponse = json.loads(rawResponse)
rowNum = 1
for rowData in jsonResponse['data']:
print "\n===== Row %d ====" % (rowNum)
colNum = 0
for columnMeta in jsonResponse['meta']['view']['columns']:
if columnMeta['id'] > 0:
print columnMeta['name'], ' = ', rowData[colNum]
colNum += 1
rowNum += 1
Output
74 potholes are listed. Below is a screenshot of the first four
When I look through the output, I notice a number of rows have STATUS = Completed - Dup. These are duplicate entries for the same pothole. Since I don't want to over-report the number of potholes, a new filter is needed. Read on.
Example of more complex geo query
This filter will do the same query as above plus filter out any rows with a status that has 'Dup' in it. A shorthand of the filter:
(AND(within_circle(location, latitude, longitude, radius)),(NOT_CONTAINS(status, 'Dup')))
Inline filter
I only changed the query value. The rest of the code is the same. Here's that updated query:
"query": {
"filterCondition": {
"type" : "operator",
"value" : "AND",
"children" : [ {
"type": "operator",
"value": "within_circle",
"children": [ {
"type": "column",
"columnId": 2793590
},{
"type": "literal",
"value": 41.9249
},{
"type": "literal",
"value": -87.6876
},{
"type": "literal",
"value": 100
} ]
},{
"type" : "operator",
"value" : "NOT_CONTAINS",
"children" : [ {
"columnId" : 2776630,
"type" : "column"
},{
"type" : "literal",
"value" : "Dup"
} ]
} ]
}
}
Output
This time only 15 rows are printed. The rows noted as dup are no longer included.
If you study the output, there is a column for Number of Potholes Filled on Block. This has values ranging from 0 to 40. The filter could be expanded to skip rows with zero potholes filled. Your app might do something special with streets where many potholes were filled. This example doesn't need to go that far but you can start thinking of the possibilities.
I'm also noticing other oddities in the data. Potholes filled on 2400 N Western have the same lat and long as potholes filled on 2400 W. Fullerton. So, beware of the data.
Summary
You can do geo-queries on data sets with a location field. Pick an address, geocode it to get the lat/long, and find all rows within a radius from that address. The first program in this example showed how that is done. The second program added a test on another column in the dataset to refine the search results. Take a look at the Example #18 for more on geocoding.


No comments:
Post a Comment